Nobody says they distrust the dashboard. They just stop opening it, and start asking an analyst for the number by email instead. By the time an executive is quietly maintaining their own spreadsheet, the reporting layer has already failed, and usually not for the reason the data team assumes.
The instinct is to look at the plumbing. Jobs are green, loads are landing, the warehouse is up. The pipeline is fine. What has gone wrong is that the same metric is defined in four places with four slightly different answers, and no one can say which one the board deck used. An analytics data pipeline earns trust at the definition layer, and that is where most of them are thinnest.
Trust breaks at the definition, not the plumbing
There is a useful asymmetry worth stating plainly, because it determines where engineering effort should go.
Pipelines fail loudly. A job throws, a load times out, a schema changes, an alert fires, somebody fixes it. The failure is noisy and short-lived.
Metrics fail quietly. A filter that should exclude internal accounts gets dropped. A join starts duplicating rows for customers with two addresses. A date column switches from event time to ingest time. Nothing errors. The dashboard still renders a number, and the number is still plausible, which is exactly why it survives for months.
A pipeline failure costs you a morning. A definition failure costs you a decision, and you find out two quarters later.
This is also why green job monitoring is a poor proxy for data trust. It answers "did the machine run" rather than "is this number the one we agreed on." Both matter, but only one of them is what the person reading the dashboard is actually asking.
Define each metric once, in code, with an owner
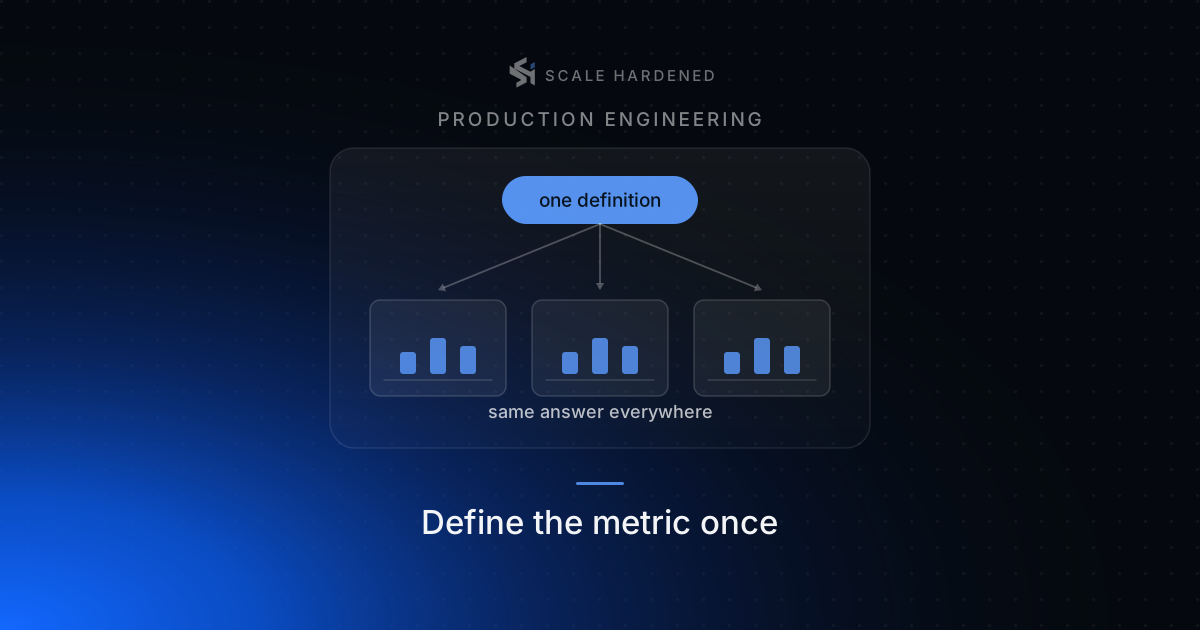
The single highest-leverage change in most reporting stacks is to stop letting dashboards compute metrics.
A dashboard should select a pre-computed, named measure. It should not contain the business logic for what counts as revenue, which accounts are excluded, or how a trial converts. The moment that logic lives in a dashboard, it has been forked, because the next dashboard will reimplement it slightly differently and both will look right.
What "defined once" means in practice:
- One definition in the transformation layer, version-controlled, reviewed like any other code change.
- A named owner for each metric, who is a business owner rather than the engineer who wrote the SQL.
- The edge cases written down beside it. Refunds, internal accounts, test orders, partial periods, currency conversion, and what happens to a cancelled order from a prior month. These are the decisions that cause two numbers to diverge, and they are business decisions, not technical ones.
- A changelog. When a definition changes, record when, why, and who approved it. A number that moved because the definition changed is not a data quality incident, but it is indistinguishable from one without this record.
That last point is the one teams skip and regret. If revenue drops eight percent on a Tuesday, the first question is whether the business changed or the definition did. Without a dated changelog, answering that takes a day of archaeology.
The pipeline has to keep history, not just the current state
Source systems overwrite. A CRM holds the deal's current stage, a billing system holds the current plan, an inventory system holds the quantity on hand right now. None of them reliably tell you what was true last March, which is precisely what most interesting questions need.
If the pipeline only mirrors current state, a whole class of question becomes unanswerable, and worse, becomes answerable incorrectly. Reporting last quarter's pipeline by today's deal stages will quietly show that almost everything closed, because the deals that died were overwritten rather than preserved.
Preserving change over time is a solved problem with a standard vocabulary. The common pattern is a Type 2 slowly changing dimension, where each change writes a new row with validity dates rather than updating in place. The implementation is less important than the decision, which has to be made per entity:
| Entity | What history you need | Typical choice |
|---|---|---|
| Customer plan or tier | What they were on at the time of each charge | Keep full history with valid-from and valid-to |
| Deal or opportunity stage | Stage as at any past date, for cohort reporting | Keep full history |
| Product name and category | Current naming, usually | Overwrite, keep the stable product ID |
| Contact email and phone | Current value only | Overwrite |
| Exchange rates | The rate applied at transaction time | Store the applied rate on the transaction |
That last row generalises usefully. Where a value was used in a calculation, store the value that was used alongside the result. Recomputing historical revenue at today's exchange rate produces a number that has never been true.
Freshness is a contract, and it belongs on the dashboard
Most arguments about data being "wrong" are arguments about data being old. Someone looks at a figure at 9am, assumes it includes yesterday, and it does not.
Treat freshness the way reliability engineering treats availability: as a stated objective with a measurement and a consequence, rather than a hope. The framing in the Google SRE book's chapter on service level objectives transfers directly. For each dataset, decide the maximum acceptable lag, measure the actual lag, and alert when the objective is missed.
Three things follow from that, and the third is the one that changes behaviour:
- Declare the lag per dataset. Orders within one hour, marketing spend within a day, finance-approved revenue monthly after close. Different datasets legitimately have different answers.
- Alert on the lag, not only on the job. A job that succeeds while processing zero new rows is a freshness failure that job monitoring cannot see. Monitoring for absence rather than only for errors is the same discipline we covered in what observability actually means for an automated workflow.
- Show the as-of timestamp on every dashboard. Not in a tooltip, not on a data dictionary page nobody opens. On the dashboard, next to the number. "Revenue, as at 06:00 today" ends an entire category of dispute before it starts, and it costs one line of a query.
Most reporting does not need streaming. It needs a lag that is known, bounded and visible.
Reconcile against the source instead of assuming
A pipeline that has run successfully for six months is not evidence that it is still complete. Webhooks lapse, API pagination silently truncates, a new product line lands in a table nobody mapped, a backfill double-counts a week.
The remedy is unglamorous and it works: a scheduled reconciliation that compares the warehouse against the source on a small number of coarse measures, and reports differences to a person.
- Row counts per day for the primary fact tables, warehouse against source.
- Sum of a monetary column per period, compared to the figure the source system itself reports.
- Referential integrity. Orders whose customer ID does not exist in the customer dimension. This should be zero, and the day it is not is the day a join started silently dropping revenue.
- Uniqueness on the grain. One row per order, per day, per whatever the table claims. Duplicate rows on the grain are the most common cause of a metric that is quietly too high.
- Freshness per table, as above.
Finance is the best reconciliation partner available, because they already close the books against the source system. If the warehouse's monthly revenue agrees with the closed month to the penny, the pipeline has an external witness. If it does not, you would rather know in the first week.
Separate the tests that block a release from the alerts that wake someone
Not every failed check is an incident, and treating them identically is how teams end up ignoring all of them.
Blocking tests run before a change is promoted, and they stop it. Schema expectations, uniqueness on the grain, not-null on keys, accepted values for enumerated columns, referential integrity. These are deterministic, they are cheap, and a failure means the change is wrong.
Alerting checks run against production data on a schedule, and they tell a person something needs a decision. Freshness missed, reconciliation difference beyond tolerance, row volume outside its normal band, a metric moving more than its historical range.
The distinction matters because the second category needs a baseline. "Orders are down forty percent" is only an alert if you know what a normal Tuesday looks like. Without a baseline you will either alert on every public holiday or miss a genuine outage during a quiet week.
Retiring a dashboard is maintenance, not failure
Reporting layers accumulate. A dashboard is built for one meeting, the meeting stops happening, the dashboard stays. Two years later someone finds it, quotes the number, and the number is from a definition that was superseded.
Stale reporting erodes trust faster than missing reporting, because it is indistinguishable from current reporting. A small amount of hygiene prevents most of it:
- Every dashboard has an owner and a stated purpose. No owner, no dashboard.
- Usage is tracked. Anything unopened for a quarter is a candidate for archive.
- Archiving is a normal, scheduled activity rather than an admission that something was a mistake.
- Deprecated dashboards are labelled in place and then removed, not left findable with a quiet note.
When a warehouse is the wrong answer
The honest case against the work described above, because it is a real case and it applies more often than vendors suggest.
- One source system and a handful of metrics. If everything you report on lives in one platform and that platform reports it adequately, a pipeline adds cost, latency and a second place to be wrong. Build the pipeline when you need to join across systems.
- No need for history. If every question is about current state, the complexity of preserving change is unjustified.
- No owner for definitions. This is the important one. A warehouse does not resolve a disagreement about what revenue means, it relocates it. If nobody is empowered to settle those definitions, the pipeline will faithfully serve several conflicting answers at higher cost.
- Volumes a spreadsheet handles. A monthly export that a competent analyst reconciles in an hour is a legitimate architecture for a small company, and pretending otherwise is how early-stage teams acquire infrastructure they cannot maintain.
- Reporting nobody reads. Before building the pipeline, confirm that a decision actually changes based on the output. Reporting that informs no decision is the cheapest thing to cut and the most commonly built.
The decision is not warehouse versus no warehouse. It is whether the questions you need answered require joining across systems or preserving history. If neither, the pipeline is premature. If either, it is overdue.
A short sequence that works
- List the ten metrics people actually quote, and find every place each one is currently computed.
- Pick an owner per metric, settle the edge cases with them, and write the definitions down.
- Implement each definition once in the transformation layer, and change dashboards to read it rather than recompute it.
- Decide per entity what history you need, and implement validity dating where the answer is "full history."
- Set a freshness objective per dataset, and put the as-of timestamp on every dashboard.
- Add blocking tests for grain, keys and referential integrity, so a bad change cannot be promoted.
- Add a daily reconciliation against the source systems, and get finance to validate one closed month.
- Give every dashboard an owner, and archive the ones without one.
None of this is exotic, and none of it is the part that gets demonstrated in a tooling pitch. It is the difference between a reporting layer people argue with and one they plan against. The number does not have to be sophisticated. It has to be the same number tomorrow, and traceable to a definition somebody signed off.
If you are rebuilding reporting on foundations like these, see how we approach data pipelines and product analytics, look through the data engineering case studies, or book a strategy call to work through which of your metrics is defined more than once.